
bizpeel · Business report · Image-ChartsReport v2 · data as of 2026-10-22

Image-Charts
www.image-charts.com
How did a one-founder chart API earn $542k in ten years, and why is it slipping now?
Product at a glance
- What it is
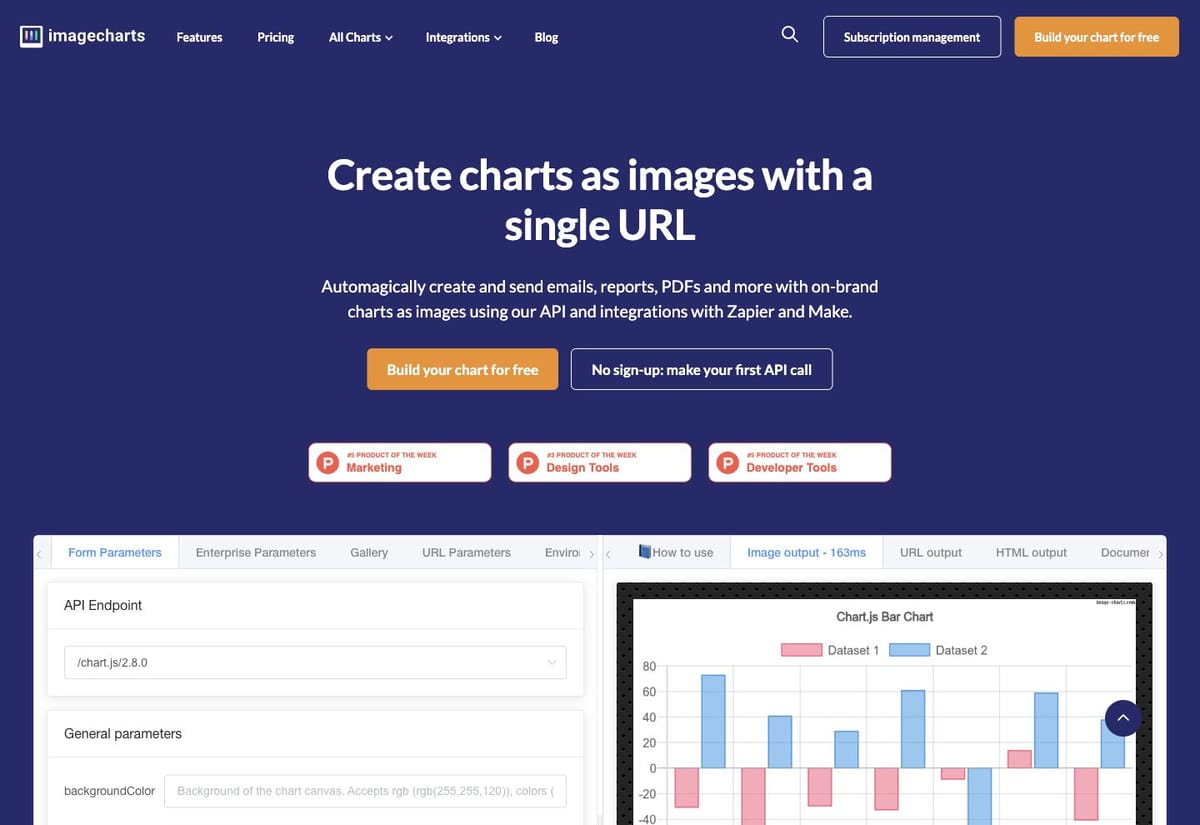
- A chart-image API: a URL with parameters comes back as a chart image you can put in emails, PDFs, chat bots and automations, with partial support for legacy Google chart parameters.
- Who it is for
- Developers, marketers and business teams who generate charts automatically in reports and emails, especially those moving off Google Image Charts.
- How it charges
- The free tier needs no sign-up but adds a watermark and rate limits. Paid plans are Business at US$99.95/month or US$1069/year, and Enterprise at US$249/month or US$2689/year.
- Business model
- A freemium API subscription: watermarked free charts advertise it, and money comes from paid tiers that remove the watermark plus self-hosted licences.
Revenue, last 12 months
$78.3K
$22.3K in the last 6 months
MRR
$6,258
−1% in 30 days
Paying subscriptions
50
About $126 a month each
Revenue, all time
$543K
Since its late-2016 launch · verified
Revenue as of 2026-10-28 (public channels, daily)Report as of 2026-10-2201
Subscribe to read the full report
6 chapters, with every figure, post and source.
- ?Where do its visits mainly come from?
- ?How does the free version sell the paid one?
- ?Which events changed its course over ten years?
- 01Product overview
- 02Marketing map
- 03The growth plays
- 04How it uses social
- 05Timeline
- 06What to take from it
Subscribe to read the complete research
5 chapters locked · a subscription opens every report